Suppose you have done a research on both male and female. And now, during data analysis phase, you want to analyze the data only for females. In that case, you can use a feature called "Select case" in SPSS.
Steps:
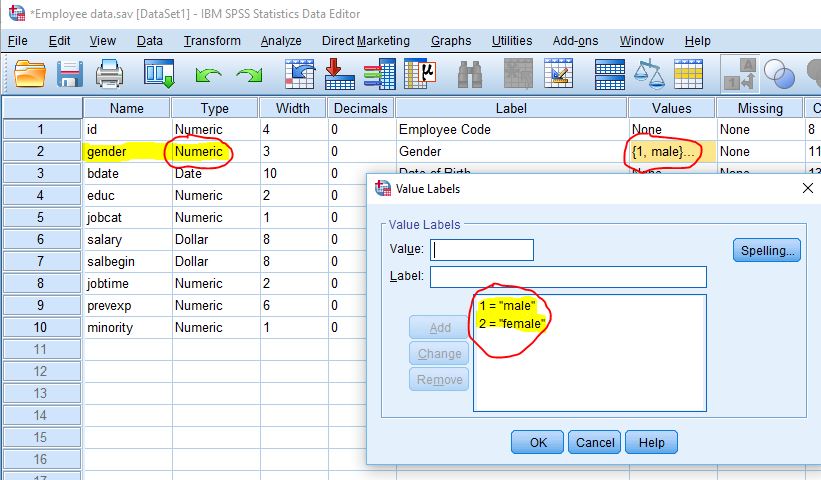
1. Identify the variable to use select case feature. For example, I have chosen the variable "gender"

3.Note down the category within the variable for which you want to use "select case" feature. Here I chose "Female" so that I can generate the outputs only for females.

4. Check if the desired category has sufficient frequency. Here, I have 216 female cases which represents 45.6% of the observation. So we have all the criteria fulfilled to use select case feature.


13. Click on ok, and you see the output showing frequency distribution only among the females. Remember that in step 4 above, we saw that we have 216 females in our dataset.

14. So, any analysis you want to run, it will give output for females only. Lets try for measures of central tendency. Here, I have tried to calculate the descriptive statistics of current salary by going to "analyze", "descriptive statistics" and then "descriptives".

15. lets try for crosstabulations. Go to analyze, descriptive statistics and crosstabs.

16. here, I have tried to find the crosstabulation between educational level and employment. Drag one variable in row and another in column. Click ok.

17. You will see the following output showing crosstabulation between education and employment among females.

18. So using the select case feature restricts the analysis to only the selected category.
After you are done with the analysis, you can reset your "select case" feature to proceed to the analysis among both male and females. for that, go to Data, click on select case and click on "Reset" and click on ok.

19. When you run the analysis now, you will see that the output will show for entire observation i.e. 474 cases (in step 4 you can see that 474 is the total cases including both male and females). See the crosstab below and compare with step 17.

So, select case feature is particularly useful when you have objective of running analysis for selected category within the variable. You can use the operators ">", "<", ">=", "<=" etc. to customize your select case feature to a desired range or to select more than one category too.
Hope you enjoyed the tutorial and please comment below for any query or feedback. See you in the next tutorial!
Thank u very much. I was searching the same condition to apply for the analysis of my data. I learned it. Thank u once again.
ReplyDelete