Response to the questions that have more than one possible answers need to be analyzed accordingly. For example,
1. What are the means of communication at your home?
a.radio
b.TV
c.newspaper
d.fax
e.internet;
The respondent might answer more than one response for the above example. Hence the data entry and data analysis for such variable in SPSS can be done with the following steps:
1. Create variables for each response in SPSS. (I have worked on the data-set "demo.sav" here which is a sample data-set available in the installation directory in your computer)

2. Those responses can be entered as "yes" and "no" for convenience.

3. Now, we should memorize which value we have used for "yes" for those responses. Usually, we give the value "1 for yes and 0 for no". In this example, we can see that the value for "yes" is 1.

4. After that, we go to analyze, multiple response and define variable sets.

5. After that a dialog box appears.
6. Drag the desired variables which are the multiple responses in the box "variables in set".
In the counted value, put the value for "yes". In the name, write the name of heading for these responses (without spaces). For example, I have types meanscom for indicating "means of communication". After that click on add and it goes to the list of "multiple response sets". Then you can see $meanscom on the right. Then, click Close

7. Now, go to analyze, multiple response response, then frequencies.


8. Then a following dialog box appears.

9. Drag the variable set ($meanscom in this example) to the right and click ok

10. Then, you see the following output.
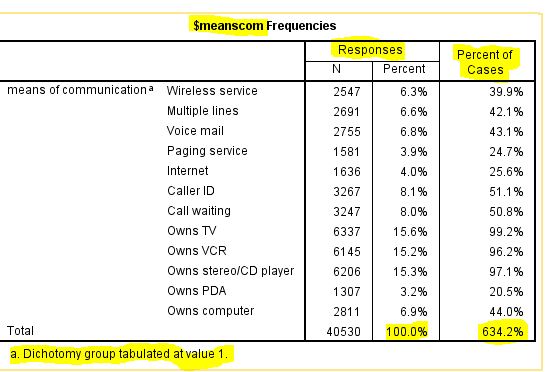
11. Interpretation of output:
In the above output, Percent of responses and percent of cases are displayed. Percent of response is the percentage of each response out of total responses from the given data-set. Thus the sum total of percent of response is 100.
Similarly, percent of cases is the percent of cases or respondents saying "yes" for the particular means of communication. i.e. 39.9% of cases had wireless service, 42.2% cases had multiple lines, 43,1% had voice mail (etc.) as their means of communication.
If you have any queries, feedback or general comments please comment below and share it to your colleagues.
See you in the next tutorial!
Hi Raj! I am currently using spss but what i dont get is which if the facts i should use for my thesis (percent of percent by cases)? Just like in your example the total in percent bt cases is not 100% and so the individual awnsers are also not lining up.. i have to make charts as and end :)
ReplyDeletehi, is there any way that we can get the correlation between one variable and another variable that has multiple answers? for example a person has to choose whether they want to move out or stay, where 1= move out and 2=stay and we need to correlate this with the condition of the house, where 1=worst, 2=bad, 3=satisfactory, 4=good, 5=excellent. in this case i want to find out the significance of the condition of the house on the decision of whether or not the occupants want to move out.
ReplyDeleteIn this case,the variable condition of the house is not a multiple response variable and therefore can be a ordinal variable.
DeleteThere is no need for you to use the multiple response fonction.
If you don"t mind proceed with this extraordinary work and I anticipate a greater amount of your magnificent blog entries KIU Community News
ReplyDeleteThis is a good post. This post gives truly quality information. I’m definitely going to look into it. Really very useful tips are provided here. Thank you so much. Keep up the good works. Pareto diagrams
ReplyDeleteis there any way for me to do ANOVA test using multiple response question? I am doing a KAP study, and several of my socio-demographic questions are multiple response ones.
ReplyDeleteYour website is really cool and this is a great inspiring article. getresponse review
ReplyDeleteis there a post like this for correlation? i will correlate between mental health and toxic family. i used a survey questionnaire, likert scale, 10 questions for each variable
ReplyDeletehttps://www.learningspss.com/2016/05/pearson-correlation-using-spss.html
DeleteHi, I need a guide as to how to get the Mean Response Analysis (MRA) for a multiple response data set
ReplyDeleteHi, I need a guide as to how to get the Mean Response Analysis (MRA) for a multiple response data set. I am TEMIDAYO
ReplyDeleteI get smart feelings every time I scan your posts. I will enrich my data.so happy to search out smart place to several here within the post. The writing is simply nice. Thanks for the post. bank loan for commercial building
ReplyDelete