Many of us want to generate the table for the data such as “age” or “income” or “systolic blood pressure” but since the data vary by person to person, the table becomes too big. In this case, we have to convert the raw data into different groups which can be done by using commands in SPSS. It is called recoding a variable.
Recoding can be of two types:
a. Recoding into a same variable that replaces the
original variable having discrete raw data
b. Recoding into a different variable that creates a new variable in addition to the original variable
Recoding into different variable
Original
variable with the quantitative raw data for other purposes like calculating
mean, median, mode, standard deviation, variance, plotting histogram etc.
Recoded variable which can be used to form frequency tables as well as correlate with other variables for hypothesis testing (such as chi-square test between age group and marital status)
4. Click on change and you see the following (I have highlighted the change as yellow)


 12. In the table, you can see that the values 1, 2, 3, and 4 are seen which were used by us during recoding of the variables, 1 means "0-20", 2 means "21-40", 3 means "41-60" and 4 means "61-80". 5 didn't show here because there was no any person of age more than 80 years.


b. Recoding into a different variable that creates a new variable in addition to the original variable
The process and the end result for “Recoding into same
variable” and “recoding into different variable” is same except only one step
which is shown in the steps below:
Recoding into different variable
We most often want to recode into different variable because
we will have two different variables as the end product.
Recoded variable which can be used to form frequency tables as well as correlate with other variables for hypothesis testing (such as chi-square test between age group and marital status)
Steps:
- first we have to determine which variable should be recoded. I will show the steps with reference to the sample data file “demo.sav” which is in the installation directory when we install the software in our computer. Note that the variable should be quantitative which means that the data entered should only be the numbers such as “age”, “weight in kg”, “systolic blood pressure”, “income in dollars” etc.
- Click on "transform" and click on "recode into different variable"

- Select the desired variable and move it to the right box as shown in the picture. I selected age here which is a numeric variable.After that in the output variable box, write the name of the variable to be formed after recoding. Note that the variable name can not have space, so I wrote "aggrp". The explanation of the variable can be written in label box as "age group" as shown in the picture,


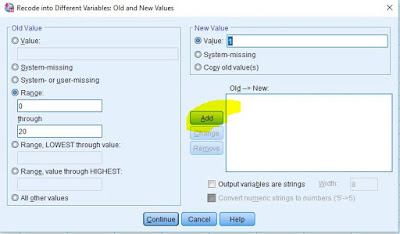
5. After that click on old and new values and you see the following dialog box, in the box, select "range" and insert the lower and upper limit of the first group there. In the picture, 0 is the lower limit and 20 is the upper limit. It depends on your data set. In the right hand side, insert any numeric code for that group. For convenience, start with "1". Note that you can not use any letters or symbols here but only the numbers.
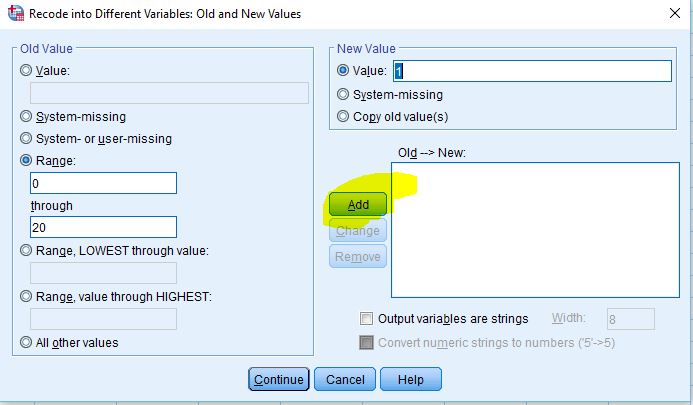
6. When you click on add and you see the following change:

7. After that in the range, fill another lower and upper limit for next category such as 21 through 40 and in the value, type 2, and then click add. Keep on adding and finally you see the following box. Note that you can also use the options "range, LOWEST through value" to create your first category and "Range, value through HIGHEST" to create your last category.

8. The number of groups and the group width depends on your data as well as your study objectives. After that click on continue and click on ok.
9. After that when you click on analyze, descriptive statistics and frequency, you see the following table.You can see the new variable "age group" in the list of variables and it is on the bottom of the list. Note that there should be tick mark in "display frequency tables" which is there by default.

10. Move the variable to the right box by clicking on arrow in the middle.
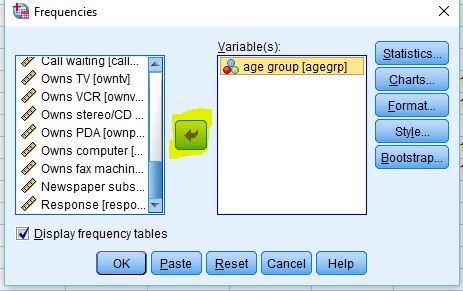
11. Click on ok and you see the following table

13. If we want to see different type of output like "0-20" and "21-40" instead of 1 and 2, we have to carry out further steps as below.
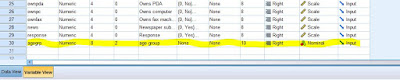
Go to variable view of your data viewer window and scroll to the bottom, you will see the variable named "age group" or any variable that you just created by recoding.
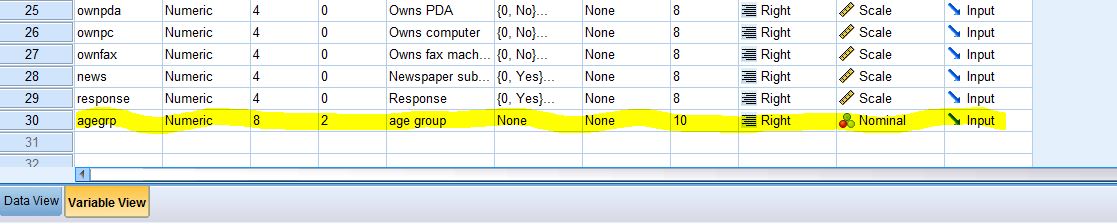
14. Click on "none" button under the column "value" of the variable "aggrp" and you will see the following box

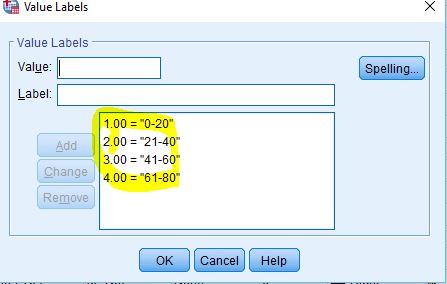
15. Click on add and repeat the steps by adding 2 for 21-40, 3 for 41-60 and 4 for 61-80, you see the following table.
16. Click on "ok".
17 Now, click on analyze, descriptive statistics and frequencies and move the "age group" to the right. The age group might already be on the right if you recently did it. And then click ok, you will see the revised output with the desired categories as below.

18. Note that the original variable "age" is also still there which can be used for other quantitative purposes such as calculation of measures of central tendency and dispersion, generation of histograms as well as application in parametric tests such as student's t-test.
Good luck and see you in the next tutorial.
Comments
Post a Comment